Introduction to IBM Planning Analytics:
In this intro to IBM Planning Analytics, we will discuss what it is, what it does, the tools to access it, and its advantages.
IBM Planning Analytics is a multi-dimensional, in-memory, online analytical processing (OLAP) business performance management solution that facilitates strategic business planning, budgeting, reporting, and forecasting. Users are able to develop sophisticated models tailored to their unique business requirements, significantly improving business decision-making and financial performance. IBM Planning Analytics delivers real-time insights, advanced analytics capabilities, flexible planning and modeling tools, concurrent collaboration, powerful multidimensional analysis, and effective integration abilities.
Terminology
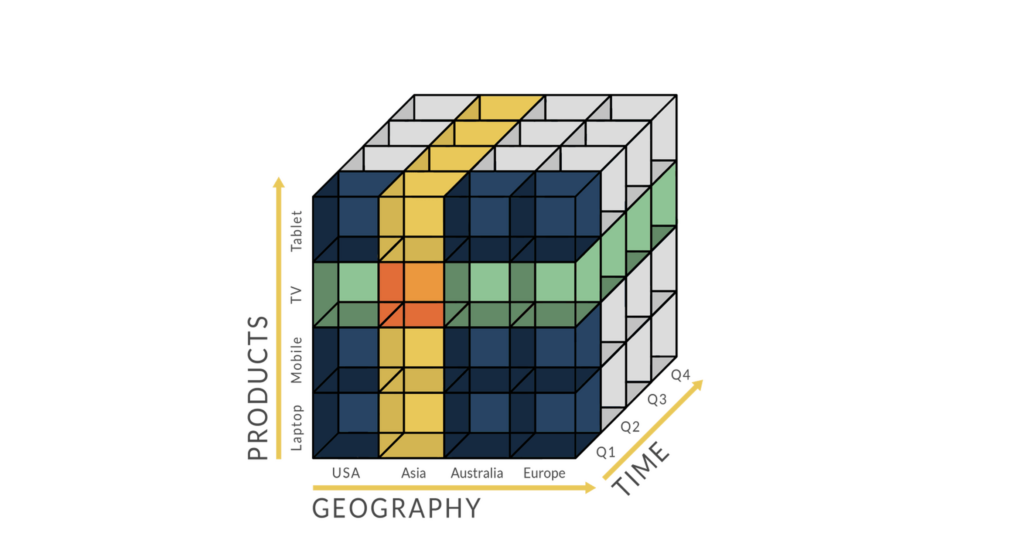
IBM Planning Analytics models are comprised of cubes that store and calculate data in a multidimensional format. Cubes can be perceived as advanced pivot tables, displaying data in rows and columns with refined analysis capabilities. Dimensions are the building blocks of cubes that define how data can be analyzed, sliced, and aggregated based on its structure. A dimension is a flat or hierarchical list of related members (also called elements). Members can possess attributes that provide additional context (e.g., color, brand, category of the members) or aliases functioning as secondary names. Cubes are created with two or more dimensions. Each cell of a cube stores data corresponding to a unique intersection of the dimensions that make up the cube.

Suppose you want to build a capital expenditure plan in your IBM Planning Analytics model where you will track actuals and forecast capex spending by department, asset type, and period. You would likely develop cube with the following structure:
**a cube can be constructed in numerous ways based on requirements and best practices; this serves as an example to illustrate the concept**
Cube: Capital Expenditure
Dimension(s):
- Version (e.g., Actuals, Budget, Forecast)
- Department (e.g., Finance, Operations, Engineering)
- Asset Type (e.g., Machinery, Equipment, Computer)
- Year (e.g., 2023, 2024, 2025)
- Period (e.g., Jan, Feb, Mar)
- Capex Measure (e.g., Purchase Amount, Depreciation)
The Capital Expenditure cube will enable you to track actuals and perform budgeting and forecasting on purchased assets and their depreciation by department, asset type, period, and year. Each cell of the cube will return data corresponding to a version, department, asset type, year, period, and measure. For example, suppose the finance department purchased office equipment for $500k in January 2022. The capital expenditure cube will display $500k in the Actuals (Version Dimension), Finance (Department Dimension), Equipment (Asset Type Dimension), 2022 (Year Dimension), January (Period Dimension), and Purchase Amount (Capex Measure Dimension) cell intersection.
Another key feature of IBM Planning Analytics models are business rules. Business rules drive data calculations and govern how the data behaves in each individual cube. Users are able to perform intricate calculations, format data, share and reference data across cubes, and override hierarchical calculations using business rules. Business rules are extremely flexible as they can apply to a specific cell intersection, to every cell within a defined area, or to the entire cube based on the definition.
Learn more about getting started with IBM Planning Analytics here.
Applications and Components
IBM Planning Analytics offers four unique tools for developing, accessing, and analyzing Planning Analytics data. Understanding the specific purpose each tool serves is crucial to capitalize on IBM Planning Analytics.
IBM Planning Analytics Workspace (PAW)
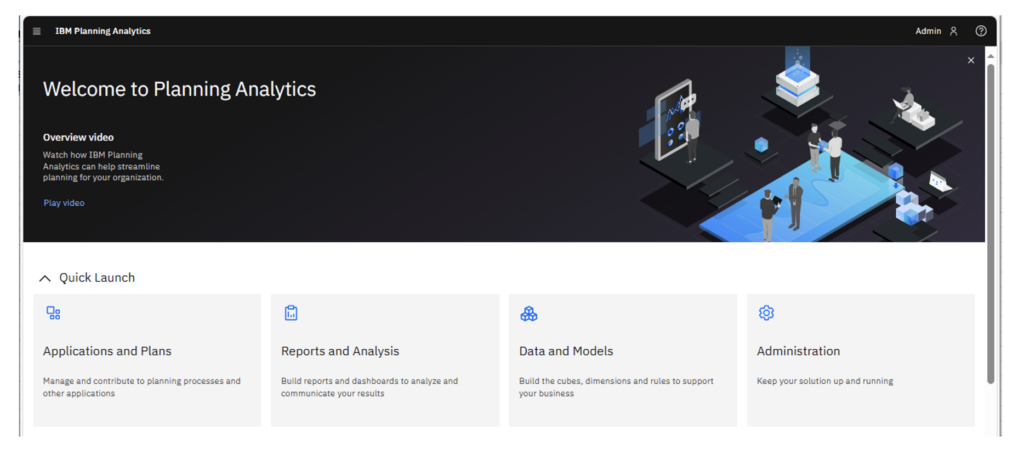
PAW is a web-based interface accessible on your local computer that is hosted on the IBM Planning Analytics system used for interacting with, developing, and analyzing IBM Planning Analytics data with out-of-the-box capabilities for planning, budgeting, forecasting, reporting, and analysis. Workspace is the most versatile tool in the IBM Planning Analytics ecosystem where users can administer, develop, report, and analyze data directly from the interface unlike other tools that specialize in one area.

- The Application and Plans section is where users can organize business processes and planning activities by grouping books, cube views, and websheets in containers for other users to interact with.
- The Report And Analysis section is where users can create books storing user-generated dashboards, websheets, scorecards, cube views, visualizations, graphics, videos, and embedded web pages in a centralized location.
- The Data and Models section is where modelers can maintain, create, update, and further-develop their IBM Planning Analytics model objects including cubes, cube views, dimensions, elements, attributes, subsets, processes, chores, and control objects.
- The Administration section is where admins can review log files, stop/start the database, maintain threads, set configuration parameters, manage users, and set security.
Learn more about IBM Planning Analytics Workspace here.
IBM Planning Analytics for Excel (PAfE)
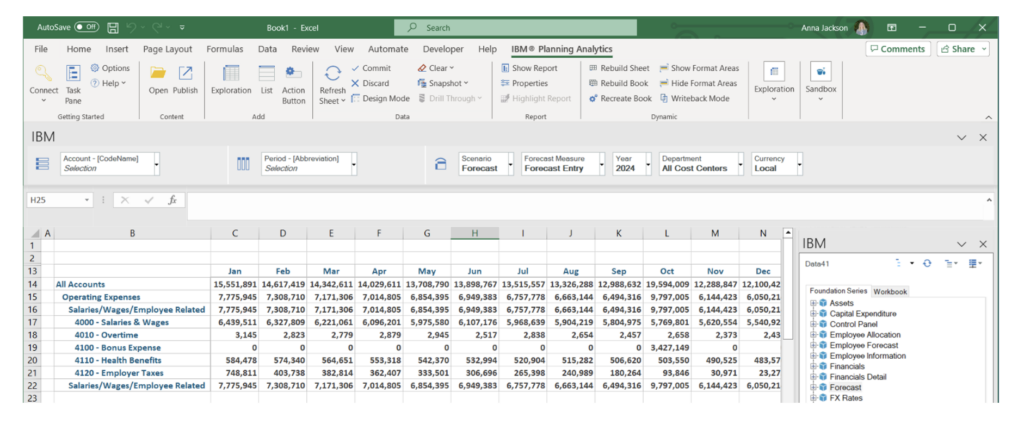
PAfE is a Microsoft Excel add-in that empowers users to create sophisticated reports and perform ad-hoc analyses using real-time data stored in IBM Planning Analytics. Users can leverage Microsoft Excel’s familiar interface, formulas, macros, and formatting while exploiting the robust modeling and analysis capabilities derived from the IBM Planning Analytics add-in. PAfE executes spreadsheet analysis without having to maintain 100+ worksheet tabs susceptible to human error. This tool enhances collaboration as users can work on the same workbook simultaneously and can share, open, or publish reports with the click of a button. Additionally, the tool offers five unique reports users can develop with their data. Read Data41’s blog on PAfE reporting functionality here.

Learn more about IBM Planning Analytics for Excel here.
TM1 Web
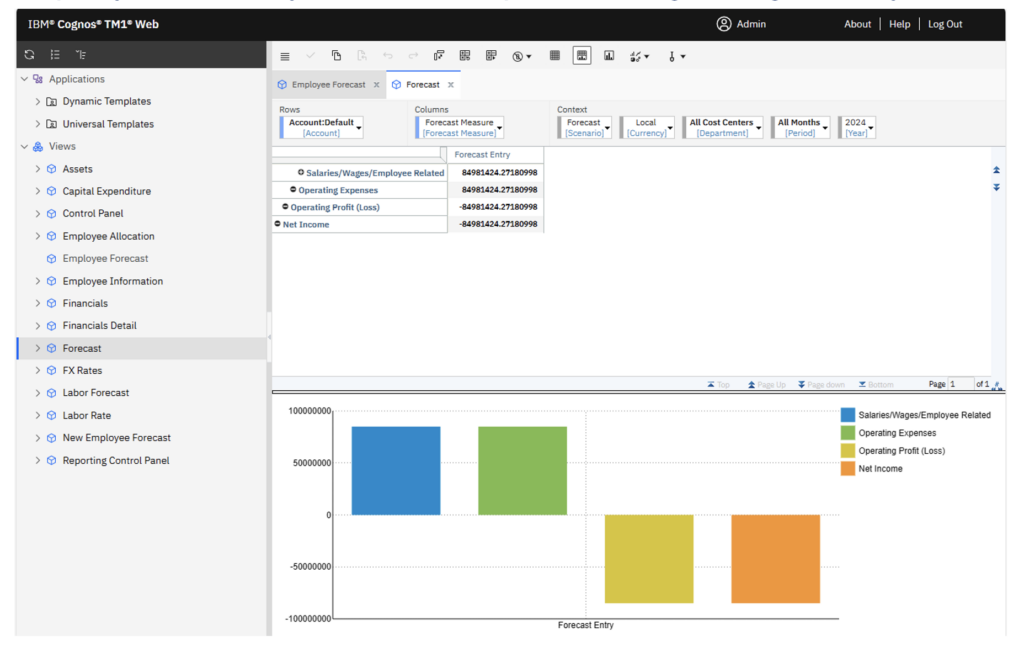
TM1Web is a web-based interface accessible on your local computer that is hosted on the IBM Planning Analytics system primarily used for interacting with pre-built reports and analyzing cube data. TM1Web has a user-friendly interface and provides direct access to cubes and reports created in PAfE. Users are able to interact with pre-build reports, perform ad-hoc analyses on cube data, and create simple visualizations directly from the interface. TM1Web was one of the original tools in the IBM Planning Analytics ecosystem but has declined in popularity due to Workspace possessing the same capabilities with additional features. However, it’s simplicity and familiarity contribute to its persistent usage throughout the years.

Learn more about TM1Web here.
Architect
Architect is a desktop application accessible in a remote desktop session within your IBM Planning Analytics system primarily used by administrators to develop, design, and maintain the IBM Planning Analytics model. Administrators are able to set security and build their IBM Planning Analytics model objects directly from the application. Architect was one of the original tools fundamental for creating and maintaining the IBM Planning Analytics model but is now only used for special cases or by developers who have a higher proficiency using the tool, due to the release of Workspace which possesses the same functionality in a more user-friendly interface.

Learn more about Architect here.
Conclusion
This intro to IBM Planning Analytics proves that the solution has powerful forecasting and budgeting capabilities that can transform organizations that leverage the tools described above. The solution’s robust suite of scenario modeling, collaboration, dashboarding, and multi-dimensional analysis enhances business operations and performance. As the business landscape continues to progress and increase in complexity, IBM Planning Analytics’ flexibility enables organizations to adapt, innovate, and maintain their position in the forefront of their industry.
